
 ENGLISH


In 1994, optical coherence tomography was employed for the first time for the imaging of the ocular anterior segment, generating cross-sectional images with a resolution of less than 20 μm and a sensitivity exceeding 90 dB, which facilitated non-contact biometric measurements, including corneal thickness, anterior chamber depth, and evaluation of the drainage angle [1]. Following the introduction of SD-OCT in 2002 [2], it became possible to measure the thickness of the corneal epithelium. In 2005, the first commercially available SD OCT device was developed, followed by the first system capable of generating corneal epithelial maps (Optovue Avanti OCT) in 2017 [3]. The device generates cross-sectional A-scans by utilizing data derived from the interference of light waves. In the next step, a Fourier transform is employed to combine the cross-sections into a two-dimensional image [4].
Physiologically, the epithelium consists of 4-5 cell layers and a single basal layer, which is attached to the Bowman’s layer through hemidesmosomes [5]. The refractive power of the cornea is approximately 40 D, with the epithelium contributing around –1.4 D. The refractive index of the epitheli- um, anterior stromal surface, and posterior stromal surface is 1.401 (SD ±0.005), 1.380 (SD ±0.005), and 1.373 (SD ±0.001), respectively [6]. Thus, changes in epithelial thickness, e.g. due to anterior segment diseases or contact lens-induced hypoxia, affect the refractive power of the epithelium and increase the risk of errors in refractive measurements. Examination of epithelial thickness and distribution is a valuable tool in the screening diagnosis of corneal diseases in individuals considered for refractive surgery. It is also useful in planning the procedure itself, especially in patients with irregular corneas and undergoing reoperation [7].
In healthy eyes, the epithelium has an uneven distribution. It is thicker in the inferior quadrants (54.0 μm ±3.8) and thinner in the superior quadrants (51.9 μm ±3.5). The average thickness in the central region is 53.9 μm ±3.9. Epithelial thickness is greater in males (mean 54.9 μm ±3.7) than in females (mean 53.0 μm ±3.5) in all sectors except the superior outer periphery. No relationship was found between epithelial thickness and age (p = 0.328); intraocular pressure (p = 0.334); biometric parameters (p = 0.433); and visual defect (p = 0.775), in either sex. With age, epithelial thickness decreases peripherally in the superior (p = 0.039, R = −0.152) and temporal (p = 0.042, R = −0.150) sectors, but the correlation is weak. In the cited study, Hashmani et al. used an SD-OCT device (Optovue, Inc.) [8].
Epithelial thickness varies between healthy eyes and those with keratoconus. In a study using SD-OCT (RTVue, Optovue Inc., Fremont, CA, USA), the mean epithelial thickness was 52.3 μm ±3.6 in the center, 49.6 μm ±3.5 in the superior sector, and 51.2 μm ±3.4 in the inferior sector in normal subjects, and 51.9 μm ±5.3 in the center, 51.2 μm ±4.2 in the superior sector, and 49.1 μm ±4.3 in the inferior sector in patients with keratoconus. Compared to healthy eyes, in keratoconus-affected eyes the epithelium in the inferior sector is thinner (51.2 μm ±3.4 vs. 49.1 μm ±4.3), the minimum thickness is smaller (46.0 μm ±4.3 vs. 40.0 μm ±6.0), and the differences in thickness between the superior and inferior quadrants and between the minimum and maximum thickness is greater (−1.6 μm ±1.8 vs 2.1 μm ±5.4 and −8.8 μm ±3.5 vs. −18.7 μm ±8.0, respectively) [9]. In another study, using a Humphrey-Zeiss OCT 2000 system (Humphrey Systems, Dublin, CA) equipped with a custom-made visible light laser, corneal and epithelial thickness maps were generated in three groups: patients without corneal diseases (control group), patients without keratoconus wearing hard contact lenses, and patients with keratoconus wearing hard contact lenses. In the control group, the central corneal thickness (CCT) was 516.9 ±21.3 μm, in the group of hard lens-wearers it was 517.8 ±31.5 μm, while in the group with keratoconus the central cornea was the thinnest (446.8 ±68.1 μm). Irrespective of the CCT values, in each group the measurement values obtained in the peripheral parts of the cornea were higher compared to those in the corneal center (the authors did not provide numerical values). Central corneal epithelial thickness was 53.6 ±2.2 μm; 50.0 ±3.9 μm; and 43.7 ±6.5 μm in the respective groups. Peripheral epithelial thickening was noted, with the highest thickness observed in the superior sectors (68.0 ±8.5 μm, 67.9 ±7.8 μm, and 63.8 ±7.7 μm, respectively) and the lowest in the inferior sectors (58.0 ±4.3 μm, 58.7 ±3.7 μm, and 55.1 ±5.0 μm, respectively). At the periphery, the epithelium exhibited greater thickness compared to the center. It was most prominent in the superior sectors (68.0 ±8.5 μm, 67.9 ±7.8 μm, and 63.8 ±7.7 μm) and the least prominent in the inferior sectors (58.0 ±4.3 μm, 58.7 ±3.7 μm, and 55.1 ±5.0 μm). In the group of patients with keratoconus, the thinnest epithelium was detected paracentrally within the inferotemporal sector, measuring 42.3 ±5.2 μm. Notably, this area also exhibited the most prominent stromal thinning [10].
During extended or overnight use of contact lenses, the corneal water balance is characterized by hypoxia, which causes an increase in both corneal and epithelial thickness. This condition is attributed to diminished oxygen levels and reduced tear film evaporation occurring when the eyelids are closed during sleep. In a study comparing the thickness of the corneal epithelium and stroma between patients whose eyelids were taped shut during the night and the control group, the period of corneal edema was longer in the group with taped eyelids. Initially, the epithelial and stromal thickness was comparable in both groups. However, after two hours, an 8.1% increase in the thickness of the epithelium and a 5.5% increase in the thickness of the entire cornea was observed in the group with taped eyelids [11], persisting for another four hours. In the control group, there was an increase in epithelial thickness by 3.06% and in the overall corneal thickness by 7.8% after two hours. The change was sustained for an additional two hours [11, 12]. A comparison between patients with an overnight-taped eyelid and the control group revealed that the initial measurements yielded similar corneal thickness values. However, a follow-up measurement taken after two hours showed an increase in corneal and epithelial thickness by 8.1% and 5.5%, respectively, in the study group, compared to corneal thickening by 3.06% to 7.8% in the control group. After two hours, the thickness of the corneal epithelium in the study eyes reverted to the initial value, whereas pachymetry returned to the baseline after four hours. No similar relationship was found in the control group.
Based on UHR-OCT measurements, the epithelium was found to be the thinnest in the superior quadrant (42.9 ±4.1 μm), becoming thicker in the central region (49.5-50.4 μm), and reaching the greatest thickness in the inferior quadrant (55.2 ±2.5 μm). The epithelial thickness profile was stable during the eight-hour follow-up. The above studies were performed with custom-made high-resolution OCT software and interface, representing the scope of high-resolution OCT imaging [13, 14].
This paper presents cases where corneal epithelial mapping was found to be a valuable diagnostic tool. The study was conducted at the LASER Eye Microsurgery Center in Warsaw among candidates for refractive surgery and cataract surgery, and patients with keratoconus who were scheduled for cross-linking surgery. Every patient underwent an ophthalmic slit-lamp examination and Galilei tomography. The measurements were performed with the Cirrus 5000 HD-OCT camera (Carl Zeiss, Jena, Germany) equipped with a corneal overlay, producing a single scan consisting of 20 B-scans, each composed of a total of 1024 A-scans, 9 mm in width and 2 mm in depth. According to the manufacturer, the repeatability of the instrument when measuring central corneal thickness (CCT) in healthy eyes, defined as the square root of variance, is 1.197. Compared to ultrasound pachymetry, the Cirrus 5000 HD-OCT system typically registers lower CCT values, by an average of –9.06 ±5.63 μm. A limitation of the study is the fact that only corneal thickness was assessed, without determining epithelial thickness [15].
KERATOCONUS
Prior to the introduction of OCT, studies were conducted on material derived from transplant recipients, who exhibited very advanced symptoms of keratoconus. The advent of modern in vivo corneal imaging has enabled the observation of early-stage tissue remodeling. Corneal epithelial mapping is helpful in the early detection of keratoconus, before clinical symptoms appear, reducing the risk of complications including iatrogenic corneal ectasia following laser vision correction surgery procedures, such as LASIK [16]. The disease is initially asymptomatic, with subtle changes revealed on additional examinations, including elevation of the posterior corneal surface on tomography, vertical ‘coma’ aberration in wavefront analysis, and thinning of the epithelial layer on high-resolution optical coherence tomography [17, 18]. Traditional topography employs a Placido disk or a laser emitting diode to generate a map of the corneal surface. An advantage of such devices is quick measurement time, but a drawback is their reliance on the accuracy of light ray incidence for image fidelity. In cases of irregular cornea, where the rays do not reflect perpendicularly, the examination becomes unreliable. In tomography, the image is constructed from cross-sections processed by software. The strength of the method lies in the reliable assessment of distances between different structures, but its weakness is low resolution. Examples of available devices along with their technologies are listed below (Table I) [19]. The diagnostic criteria for keratoconus include elevation of the posterior corneal surface exceeding 15.5 μm (with a sensitivity of 95.1% and specificity of 94.3% on Pentacam [20]), or exceeding 35 μm (with a sensitivity of 97.3% and specificity of 96.9% on Pentacam [21]). Preclinical keratoconus is characterized by the absence of clinically relevant symptoms, elevation of the posterior corneal surface > 29 μm (with a sensitivity of 68% and specificity of 90.8% on Pentacam [21]), keratometry exceeding 47.0 D, oblique astigmatism > –1.5 D, central corneal thickness < 500 µm, and the presence of keratoconus symptoms in the other eye. Individually, none of the aforementioned evaluation criteria have sufficient sensitivity or specificity. Hence, indices with higher predictive values have been developed, including KISA% (60-100% sensitivity in the diagnosis of preclinical KC), Randleman Ectasia Risk Score System, PTA index (post-LASIK ectasia risk assessment [17]), and classifications (e.g. ABCD) [22]. Examination of histopathological alterations in the corneas of transplant recipients revealed a higher degree of variability in corneal epithelial thickness [23]. Epithelial thickening exhibited a positive correlation with ruptures in the Bowman’s layer, which were present in 91.6% of the examined eyes. In the referenced study, stromal thickness in the center was equal to 214 ±11 μm, while in the peripheral area it was found to be 477 ±22 μm. A negative correlation was observed between epithelial thickness and central stromal thickness (p = 0.009) [24]. In the diagnosis of keratoconus, corneal topography is considered the gold standard, but methods combining the Scheimpflug camera and Placido disks are preferred. The diagnostic work-up is complemented by OCT, which generates maps of both the posterior curvature of the cornea and the distribution (thickness) of the corneal epithelium. Physiologically, the corneal epithelium is located as described above, but in patients with keratoconus it is thinner in the area of stromal elevation and thicker around [25], creating a characteristic donut pattern [26-29]. Another study comparing epithelial distribution in patients with keratoconus and healthy controls using the RTVue device (Optovue, Inc) found generalized corneal thinning, most prominently in the inferotemporal sector, and local thickening in the superonasal sector. In the same study, similar results were observed in patients with preclinical keratoconus, without deviations on clinical examination, with full visual acuity, and presenting with topographical abnormalities [30]. Stromal elevation may be initially masked by epithelial hyperplasia [25]. In patients with high astigmatism but without keratoconus (> 2D), the distribution of the corneal epithelium is relatively uniform across the entire surface (52.6 ±4.2 μm). In contrast, in patients with keratoconus, the epithelium is generally thinner and unevenly distributed. Specifically, in the center it was 45.7 ±3.8 μm, with the thinnest region in the inferotemporal quadrant (37-40 μm), and the thickest area in the superonasal quadrant (58-61 μm) [31]. Following corneal cross-linking, the epithelial surface becomes more even. A study comparing the distribution of the epithelium in eyes with keratoconus or corneal ectasia before and after CXL (corneal cross-linking) procedure found that the epithelial surface became smoother, with a reduced standard deviation between different measurement points [32].
Table I
Examples of corneal mapping instruments along with the technology used
Case 1
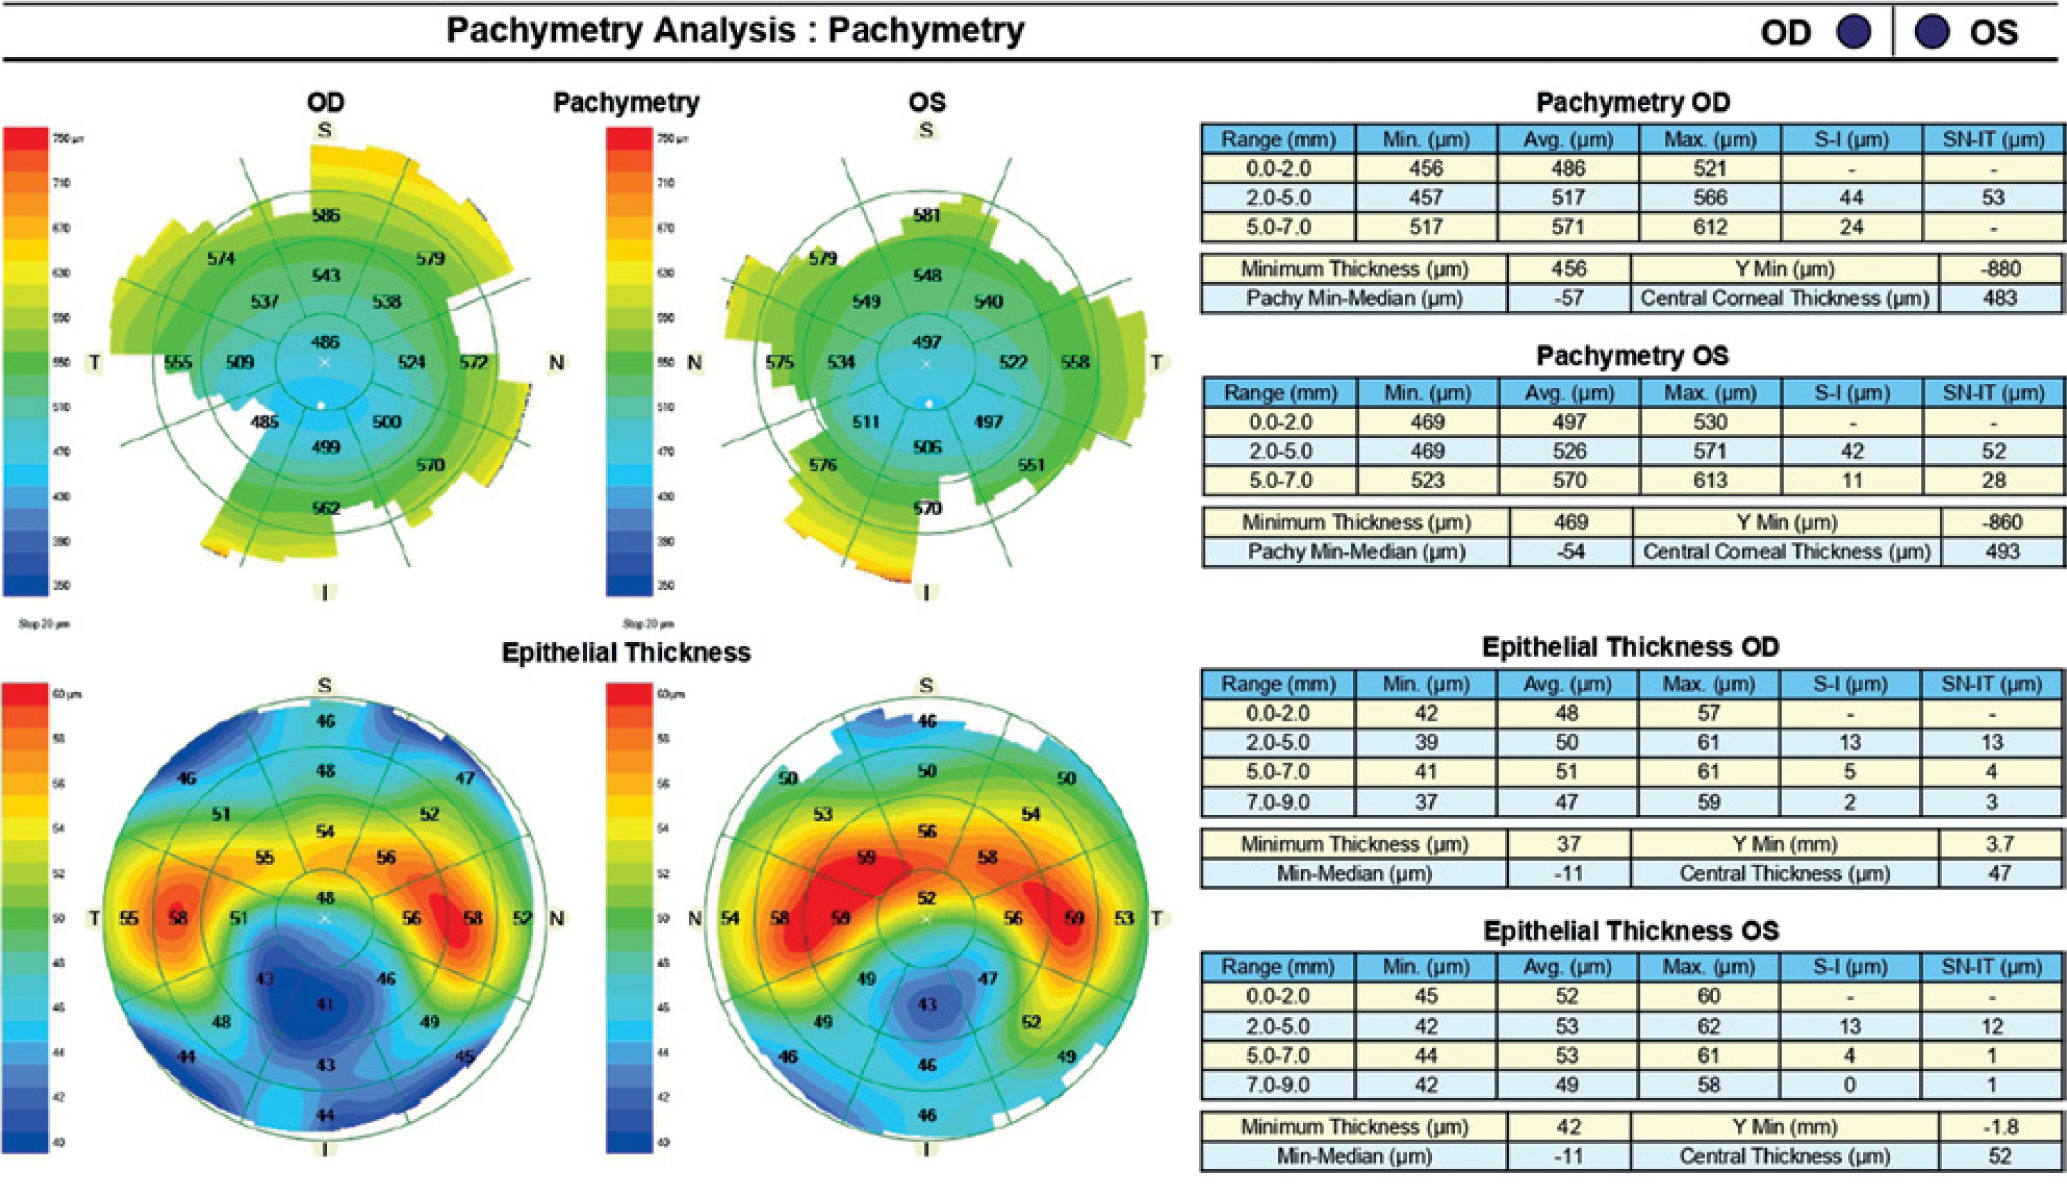
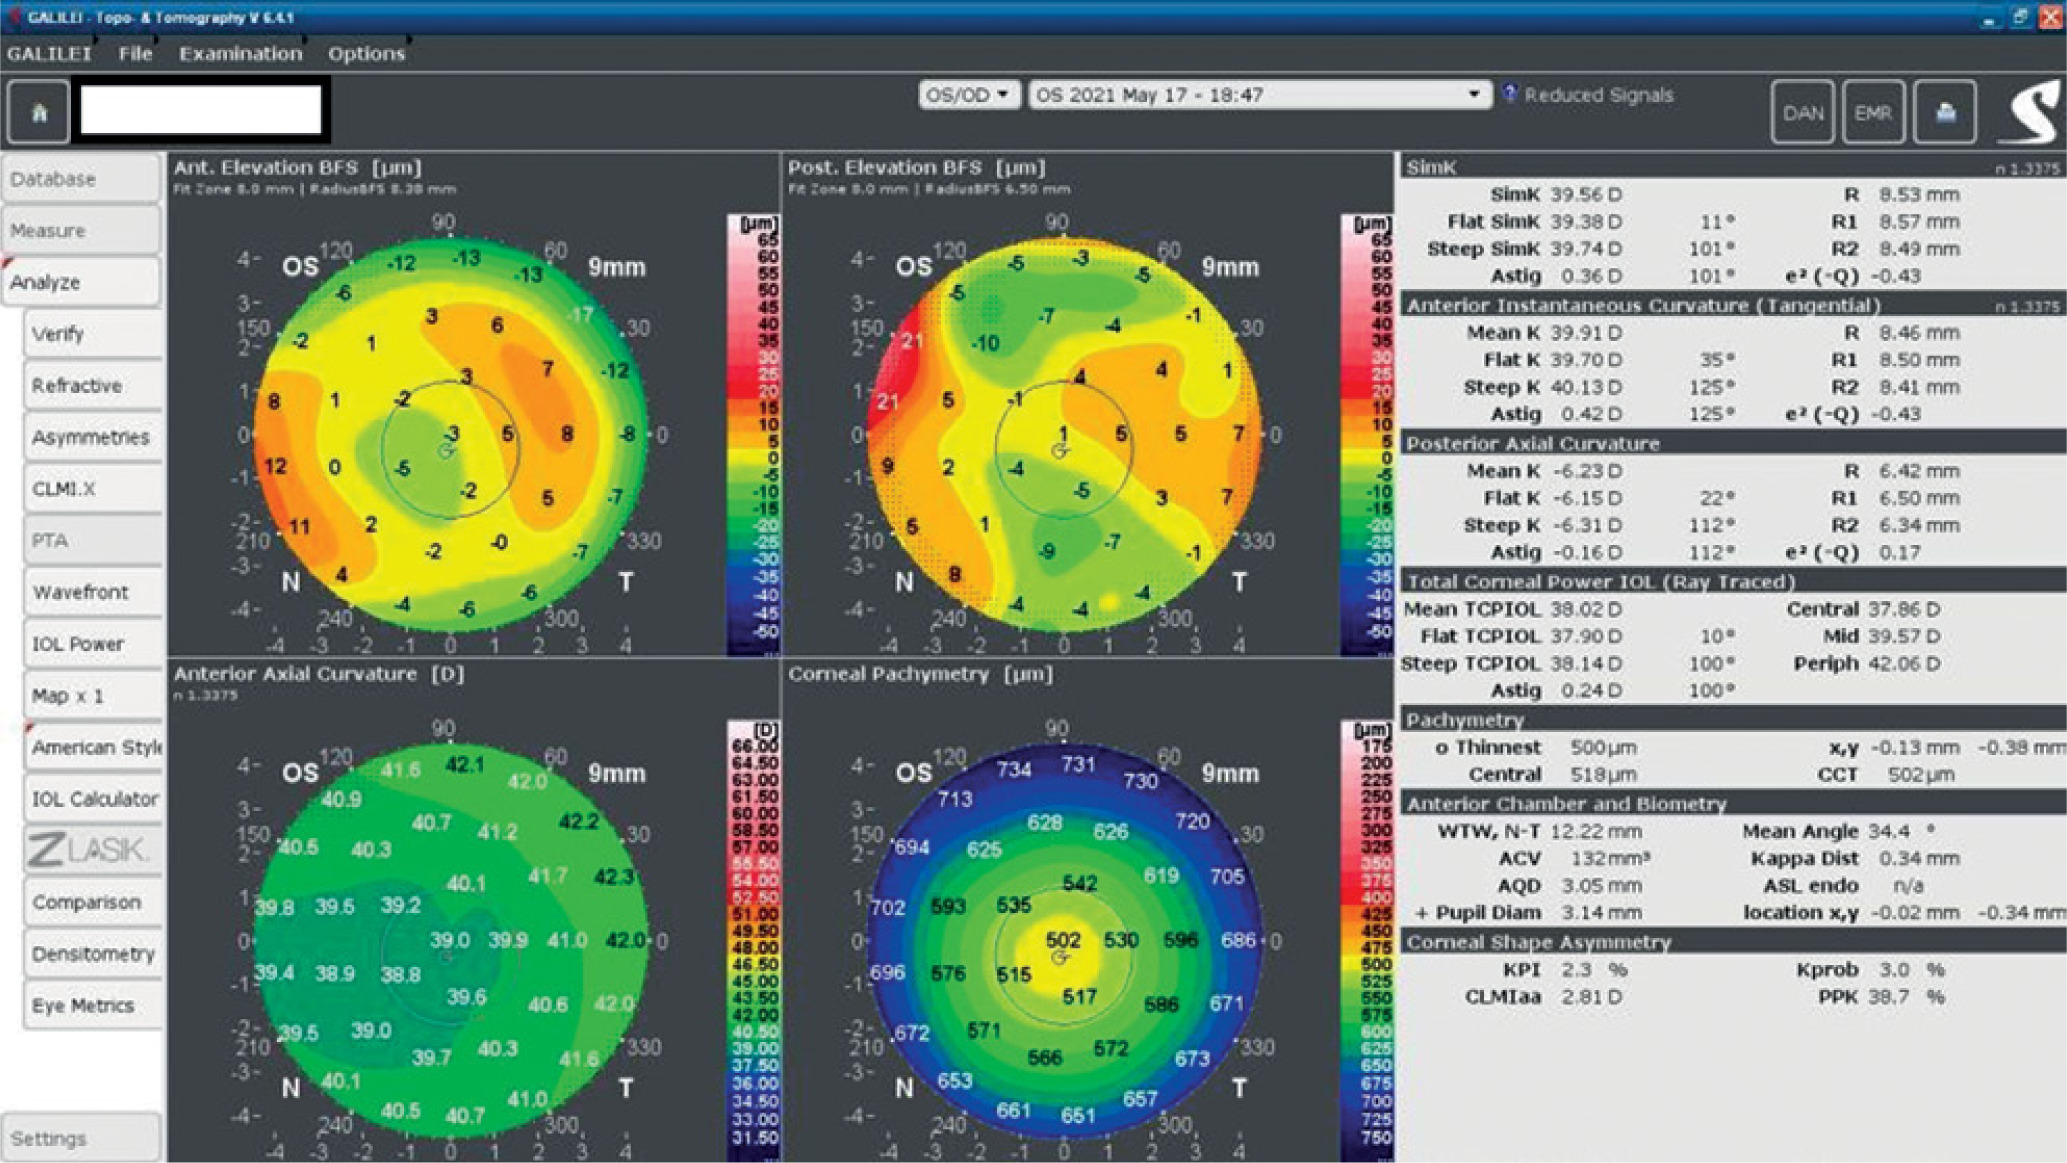
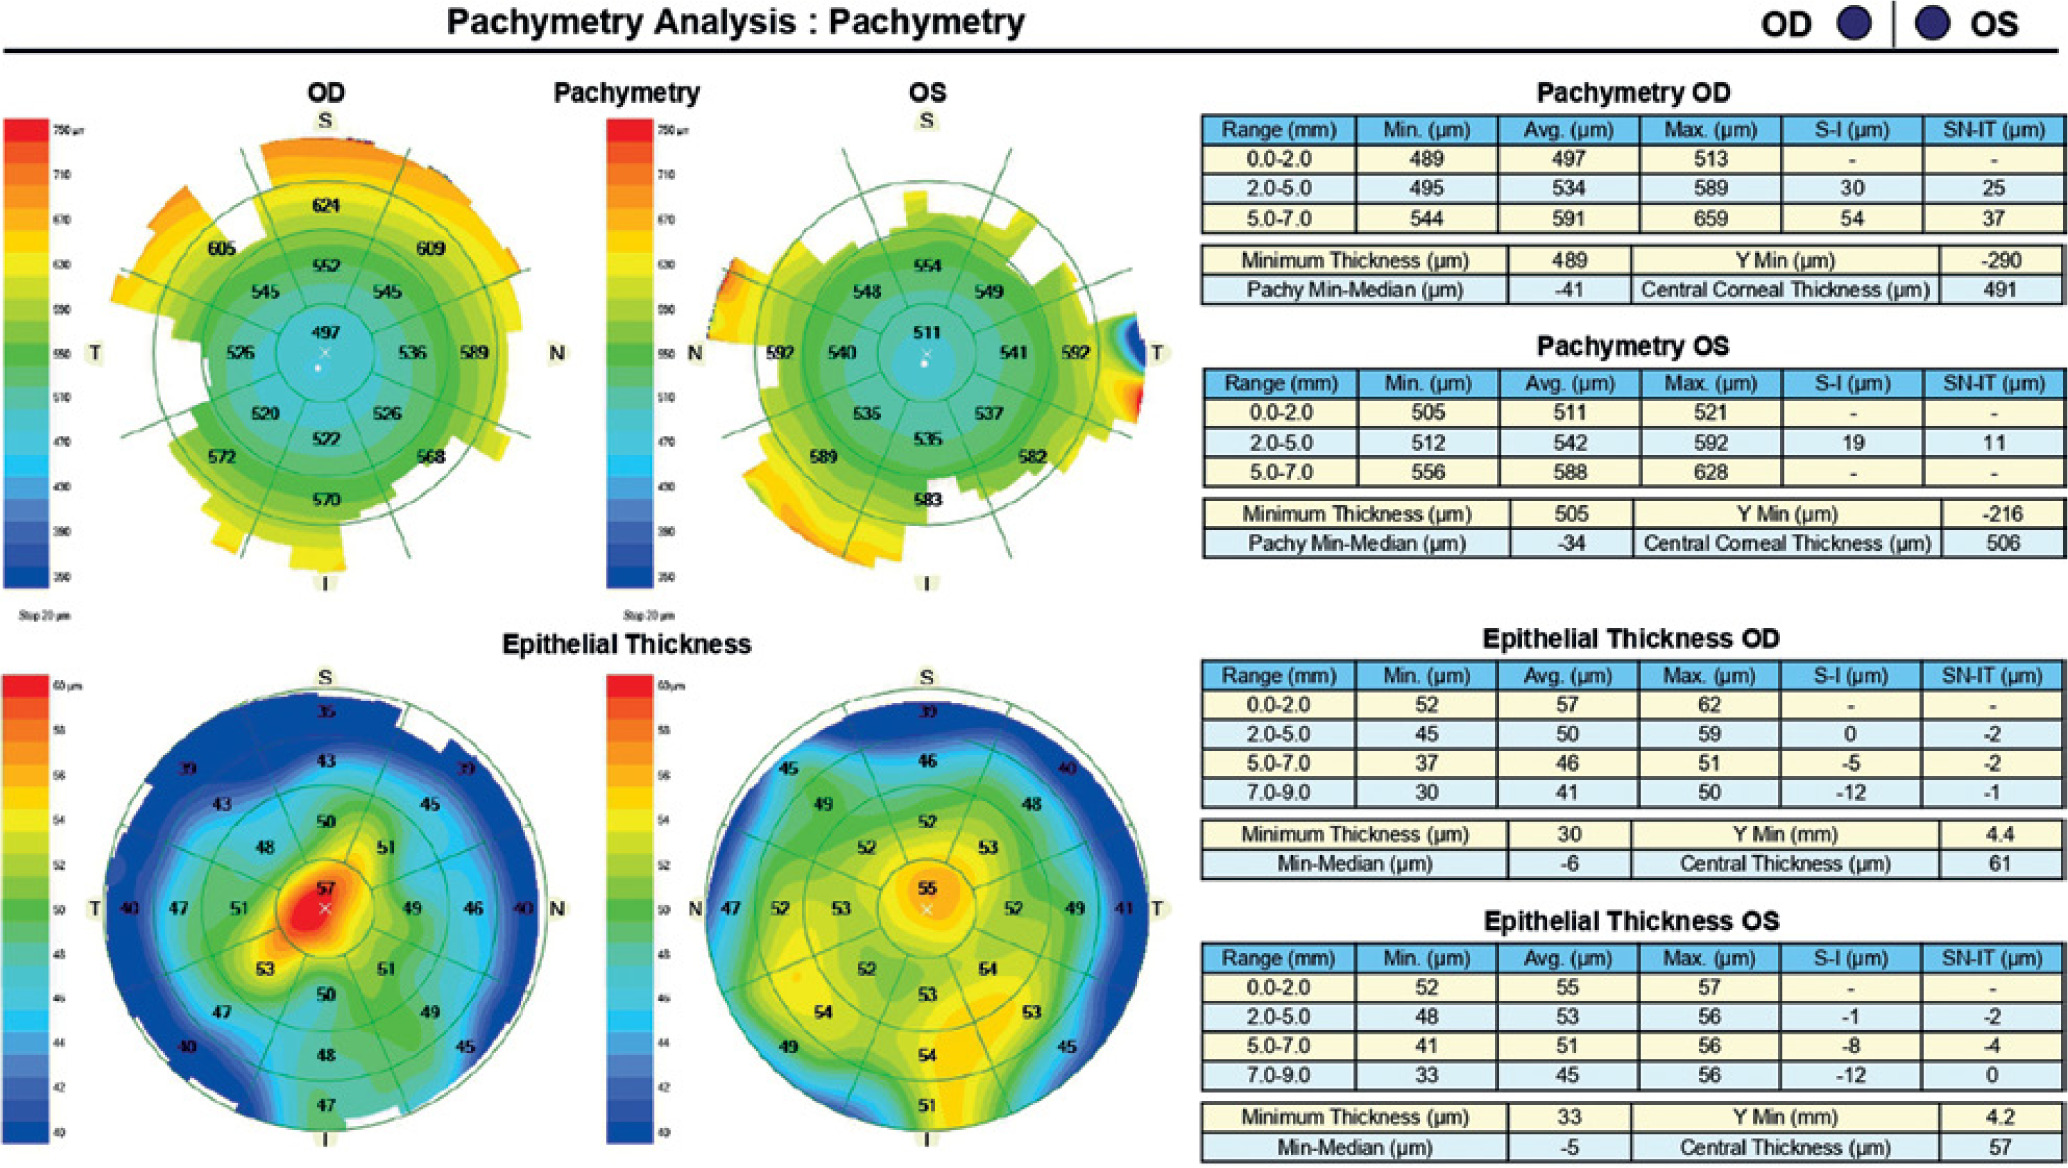
An 18-year-old man reported for an assessment of eligibility for keratoconus surgery. Following the diagnosis established six months prior, the patient noted a decline in visual acuity. Apart from allergies, the patient’s history was unremarkable. Visual acuity determined by ophthalmological examination was Vod 0.6 cc-1.0 Dsph/–2.25 Dcyl ax 90 and Vos 0.7 cc-2.0 Dsph/–1.0 Dcyl ax 80. Slit-lamp assessment revealed corneal thinning and bulging. The patient was scheduled for corneal cross-linking in the right eye. Galilei tomography showed irregular astigmatism with asymmetrical bow-tie pattern, bulging of anterior and posterior surfaces of the cornea, as well as corneal thinning (Figure 1). Epithelial mapping showed hyperplasia of the epithelium around the area of thinning (Figure 2). Epithelial mapping revealed the donut pattern consistent with corneal ectasia.

REFRACTIVE SURGERY
Corneal shape assessment plays a major role not only in screening but also evaluating postoperative outcomes. A weak negative correlation was noted between corneal epithelial thickness and refractive error in patients undergoing excimer laser ablation under the corneal flap (LASIK). For the central cornea, the regression coefficient was –0.238 (p < 0.01); and for the paracentral and peripheral regions, it was –0.172 (p < 0.05) and –0.002 (p = 0.98), respectively. This implies that variations in corneal epithelial thickness, especially at the center, may be a risk factor for higher refractive errors in patients who are scheduled for LASIK surgery [33]. A change in the distribution pattern of the corneal epithelium is also observed in patients undergoing superficial photorefractive keratectomy (PRK) for myopia. One month after surgery, epithelial thinning was observed in all sectors, with subsequent thickening, which stabilized at month 12 [34]. SD-OCT-based evaluation of changes in corneal epithelium distribution in myopic patients treated with laser ablation under the corneal flap using femtosecond laser (FS-LASIK) showed changes in the central, paracentral and peripheral regions by 2.09, 4.53, and –0.87 µm in the first month; by 3.00, 4.61, and –0.97 µm in the third month, and by 3.28, 4.55, and –0.81 µm in the sixth month, respectively. These measurements show that, after six months, there was an increase in epithelial thickness in the central and paracentral regions, and epithelial thinning in the peripheral area. Central epithelial thickness stabilized between the third and sixth months. There was no correlation between epithelial thickness and the spherical equivalent (p = 0.313) [35]. Epithelial remodeling after the SMILE procedure stabilizes faster compared to the LASIK technique. In patients treated with SMILE, there was an increase in epithelial thickness by 2.5 μm, 3.9 μm, and 4.5 μm (central, paracentral, and peripheral regions, respectively) in the first month, and by 3.0 μm, 4.2 μm, and 4.9 μm in the third month. However, the difference was not statistically significant. After LASIK, the epithelial thickness increased by 3.4 μm, 4.3 μm, and 2.1 μm after one month, and by 4.4 μm, 5.1 μm, and 2.9 μm after three months, respectively. In patients who underwent SMILE, stabilization of epithelial thickness occurred faster (within less than three months) and tissue distribution was more uniform compared to the LASIK-treated group. In both methods, the extent of epithelial thickening correlated with the degree of visual defect [36]. In a study comparing epithelial thickness before and after LASIK and SMILE procedures to correct myopia, no differences were found with regard to the increase in epithelial thickness in patients with low and moderate myopia one month after the procedure (p > 0.05). In both groups, the increase was uneven and most pronounced in the superior, superonasal, and nasal regions. In patients with high myopia (≥ –6 to –10 diopters), a greater increase in epithelial thickness was observed in the LASIK-treated group than in the SMILE-treated group. After three months, in low and medium myopia, epithelial thickening was similar in both patient groups in all sectors except the superior one, where the increase in epithelial thickness was greater among post-LASIK patients. In patients with high myopia, epithelial thickening was more pronounced in the post-LASIK group in all sectors and more uneven [LASIK: central (6.7 ±2.6 μm), superior (5.0 ±2.1 μm), and nasal (3.9 ±1.9 μm) regions vs SMILE: central (4.7 ±2.9 μm), superior (2.9 ±2.5 μm), and nasal (2.4 ±2.4 μm) regions]. After 6 months in patients with low and moderate myopia, epithelial thickening was greater in the superior and nasal sectors in the LASIK group; in patients with high myopia, the degree of thickening was similar in both groups. A negative correlation was observed between an increase in corneal epithelial thickness and a decrease in CCT [37].
Case 2
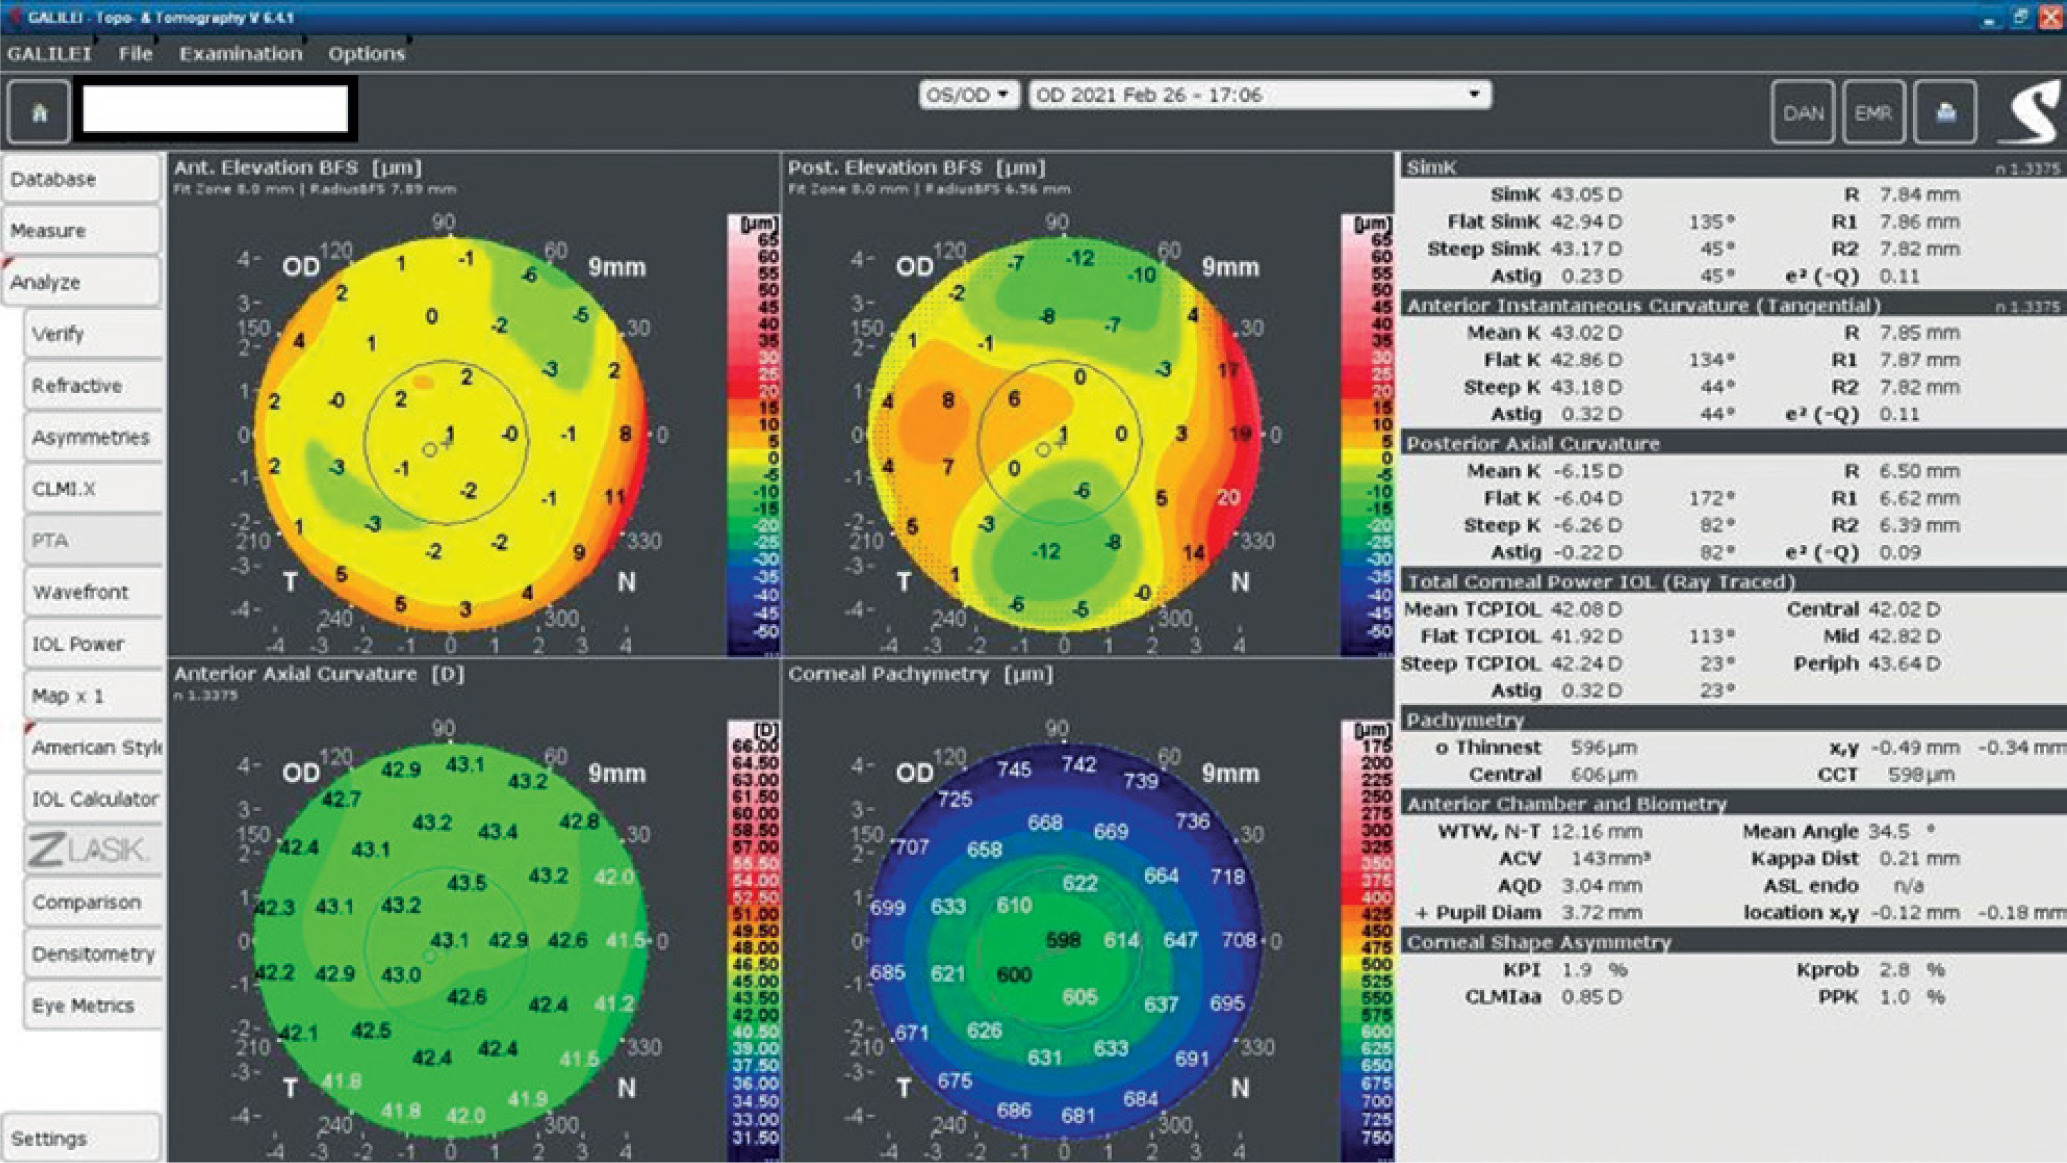
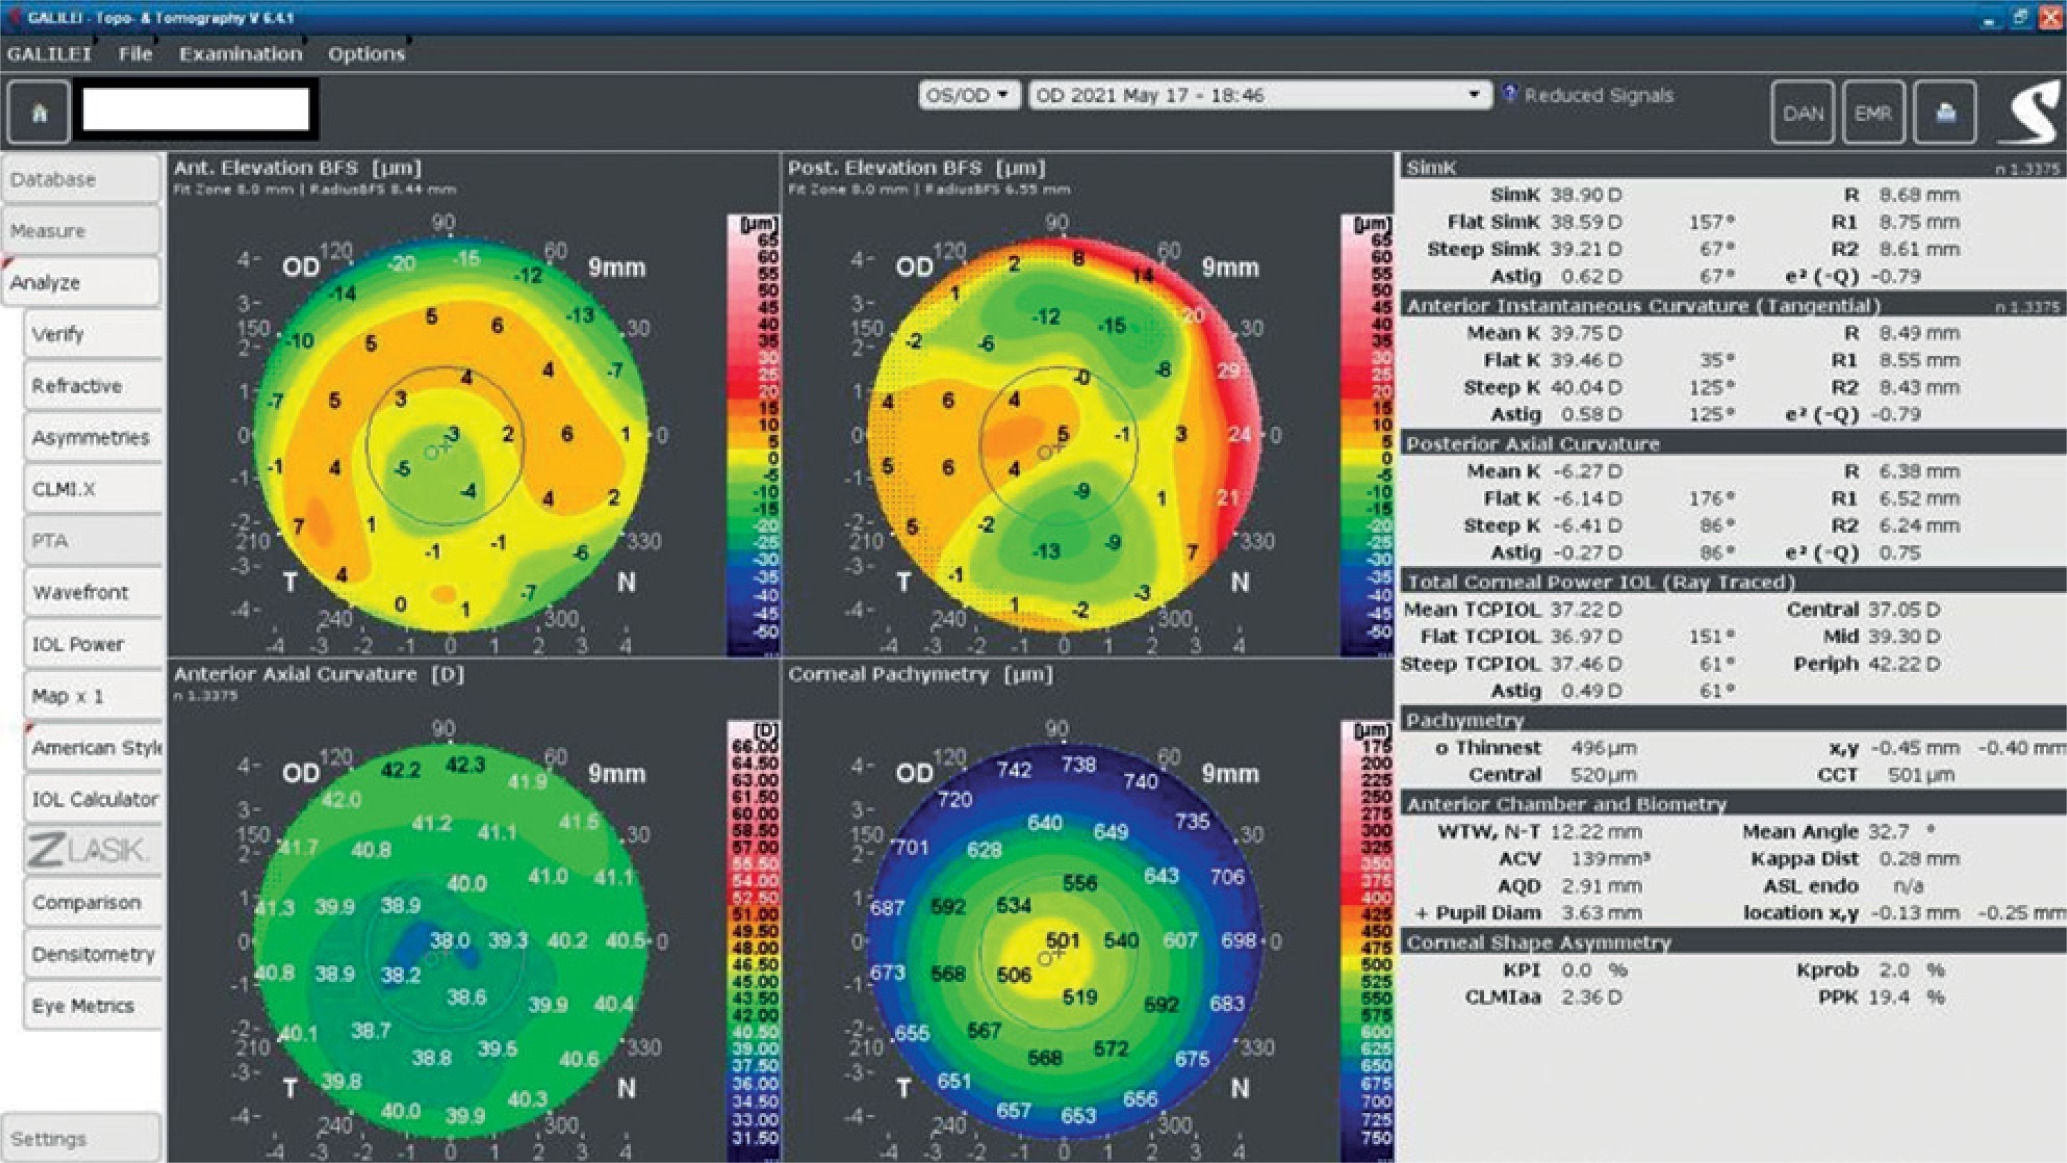
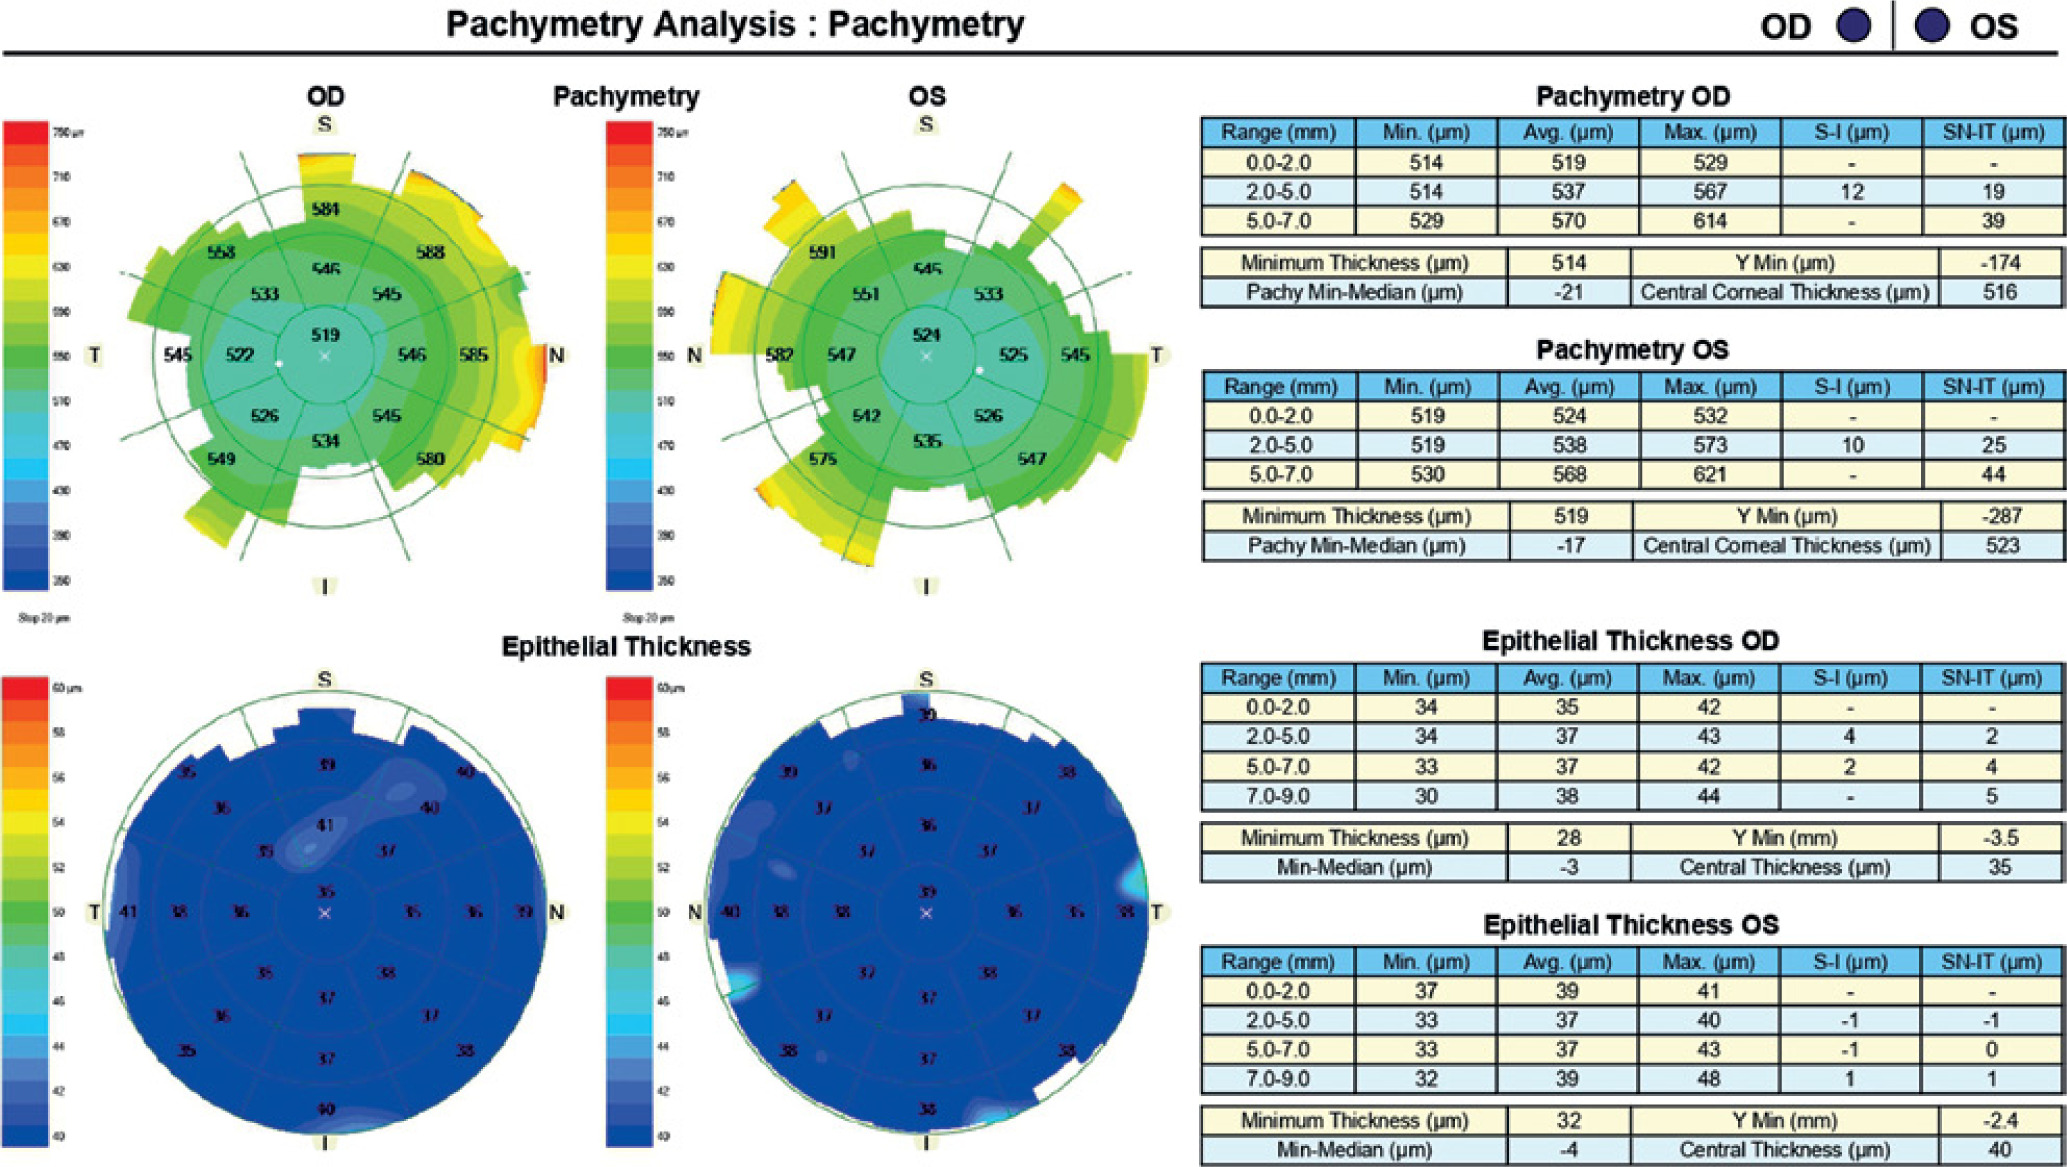
A 34-year-old woman in generally good health came for an assessment to determine her eligibility for refractive surgery. The patient’s visual acuity was 1.0 with –4.0 Dsph correction in the right eye and -4.0 Dsph/–0.25 Dcyl ax 60 in the left eye. No abnormalities were found on physical examination. Galilei tomography showed the corneal refractive power of 43.5 D and the CCT of 598 μm in the right eye (Figure 3), and 43.5 D and 600 μm in the left eye (Figure 4). No signs of keratoconus were observed. The patient was scheduled for the SMILE procedure, and the procedure was carried out without any complications. At the follow-up visit one week later, the patient reported blurred vision in the right eye. Refraction was +1.0 Dsph in the right eye and 0 Dsph in the left eye, and visual acuity was Vod 0.6 sc, cc +1.0 Dsph = 0.9 Vos 1.0 sc. There were no abnormalities on physical examination or Galilei tomography scans (Figure 5, Figure 6). Mapping of the corneal epithelium was performed, revealing localized concentric hyperplasia of epithelial cells in the central region of the right eye (Figure 7). The postoperative recommendation was maintained until the next follow-up visit, during which the patient reported no complaints. Refraction assessment did not show the hyperopia that was previously observed. The patient’s visual acuity was Vod 1.0 sc and Vos 1.0 sc, with no abnormalities found on the physical examination or additional tests.

CONTACT LENSES
Corneal epithelial thickness in contact lens wearers varies compared to the healthy controls. In a SD-OCT-based study comparing patients who had been wearing soft hydrogel contact lenses for a minimum of two years with a control group, the central epithelial thickness was 49.2 ±1.9 μm in the study group and 54.4 ±1.1 μm in the healthy control group [38]. Previous studies using modified corneal pachymetry showed corneal thinning in contact lens wearers compared to healthy controls (41 ±7 μm vs. 48 ±5 μm) [39]. Conversely, in patients who wore long-term silicone hydrogel lenses for hyperopia correction, a thickening of the corneal epithelium was observed at the center (53.27 vs. 50.91 after seven days) [40]. Patients wearing contact lenses with low oxygen permeability have a thinner epithelium compared to patients using highly oxygen-permeable lenses [41]. The use of contact lenses impacts the corneal structure at the cellular and tissue levels, and affects the homeostasis of the ocular surface. In a study comparing both eyes in patients wearing a contact lens in one eye for an extended period, the eye with the lens exhibited a 14.8% decrease in oxygen uptake, a 5.6% reduction in epithelial thickness, a 2.3% decrease in stromal thickness, a 22% increase in endothelial polymegatism, and the presence of epithelial microcysts. Epithelial thickness returned to the baseline values 33 days after discontinuing contact lens use, with stromal thickness and endothelial cell size remaining unchanged [42]. In a more recent study, based on OCT, epithelial thickness was compared between the study group (eye with a contact lens, covered for three hours), and the other eye (without a lens). After the contact lens was removed from the eye, a slight increase in epithelial thickness was observed (1.7 ±4.8%, with no statistical significance). However, after 100 minutes, epithelial thinning was noted (3.0 ±4.5%, p < 0.05). In the control group, measurements taken after lens removal from the other eye found no change in epithelial thickness, whereas measurements done after 100 minutes revealed thinning of the entire cornea. Epithelial swelling followed by thinning may serve as a regulatory mechanism to protect the cornea from hypoxia. Furthermore, the study demonstrated that epithelial remodeling was bilaterally coordinated [43]. In patients treated with orthokeratology, corneal thickening is noted immediately after the lens is removed, followed by a subsequent return to baseline values. In a study using an OCT device (Humphrey Systems, Dublin, CA), epithelial and corneal thickness was compared in patients before and after overnight wear of a hard contact lens. Corneal edema was most severe immediately after lens removal: 4.9% centrally and 6.2% paracentrally. Immediately after the lens was removed, a 7.3% thinning of the epithelium was shown. It continued to progress, reaching its peak (13.5%) on the fourth day of overnight lens wear. Following a 72-hour treatment with rigid contact lenses, both the thickness of the corneal epithelium and the entire cornea returned to their baseline values [44]. Contact lens-induced corneal deformation might have a similar appearance to early ectasia on topography, but epithelial thickness measurement can help distinguish between these two conditions. Irregular astigmatism, as detected on topography, can occur in keratoconus and be induced by contact lens wear. In the referenced study, central epithelial thickness showed no variation between patients with keratoconus, contact lens wearers, and healthy control subjects: 53 ±5 μm vs. 51 ±6 μm vs. 55 ±3 μm. Nevertheless, the maximum corneal epithelial thickness was significantly greater in individuals with keratoconus compared to the control group (63 ±7 μm vs. 57 ±3 μm). Other measurements did not reach the level of statistical significance. In cases of keratoconus, epithelial thinning was noted in the region where the corneal curvature was most pronounced on topography, while thickening was observed in the peripheral area of the protrusion. Where contact lenses are used, the epithelium tends to thicken above the area of the most severe corneal thinning. The cited study shows that corneal epithelial mapping can differentiate between ectasia and contact lens-induced distortion, but the comparison of epithelial thickness alone is not sufficient for making a diagnosis [45]. In a separate study that compared epithelial distribution maps and corneal topography in patients with keratoconus, with preclinical signs of keratoconus, with altered topography due to contact lens use, and in a healthy control group, the authors used the Pattern Standard Deviation (PSD) index. Based on the anterior curvature and epithelial distribution, the researchers developed a deformation index in the form of a map showing keratoconus as negative values and contact lens-induced deformation as positive values. This instrument demonstrates that epithelial mapping offers valuable insights for differentiating between keratoconus and atypical topography [46]. Measurement of epithelial thickness and distribution alone does not have sufficient diagnostic power, but when combined with corneal topography or an anterior curvature map, it provides a sensitive diagnostic tool, especially if all the data are correlated with each other. Based on the anterior corneal curvature to epithelial thickness ratio, the so-called Epithelial Modulation index was created, with values reaching –0.6 ±1.0 µm/m in healthy eyes, 37.0 ±23.0 µm/m in preclinical keratoconus, and 7.3 ±13.2 µm/m in forme fruste. The sensitivity of the measurement was 100 ±0%, 100 ±0%, and 53.1 ±1.5% for the symptomatic, preclinical, and forme fruste keratoconus, respectively [47].
Case 3
A 45-year-old woman without any significant health complaints came in for an evaluation of eligibility for laser vision correction due to contact lens intolerance. The patient had worn –3.0 D daily disposable contact lenses for 20 years. Her visual acuity was Vod 1.0 cc –3.25 Dsph/–0.5 Dcyl ax 180, Vos 1.0 cc –3.25 Dsph, Sn 0.5 add +1.5 Dsph (right eye), Sn 0.5 add +1.5 Dsph (left eye). During the visit, Galilei tomography revealed no abnormalities, but epithelial mapping showed global epithelial thinning (Figure 8). The patient was instructed to discontinue the use of contact lenses for a period of four weeks. After that time, there was a noticeable improvement in corneal epithelial parameters, and the patient was scheduled for PRESBYOND laser vision correction. A femtosecond laser (Visumax Carl Zeiss) was employed to create a flap measuring 8.1 mm in diameter and 120 μm in depth. The ablation was carried out using an excimer laser (Carl Zeiss MEL80), with an ablation zone of 6.5 mm in diameter and 40 μm in depth in the right eye, and 6.5 mm in diameter and 69 μm in depth in the left eye. After one month, the patient’s visual acuity was 1.0 sc to distance and 0.5 sc to near in both eyes, with no reported complaints.
CONCLUSIONS
Emerging trends in refractive surgery, including the implementation of femtosecond lasers and wavefront analysis in LASIK [48], as well as the growing popularity of SMILE and personalized ablation profiles, are broadening the scope of refractive surgery applications. However, they also highlight the importance of having precise diagnostic tools to identify patients with contraindications to surgery, such as keratoconus [49]. It is estimated that individuals with forme fruste make up between 2.9% and 18.7% of the group of potential candidates for refractive surgery [50-51]. Detecting the condition at an early stage and excluding the patient as a candidate for refractive surgery serves a dual purpose. In addition to protection from postoperative complications, it allows prompt initiation of other therapeutic modalities including corneal cross-linking (CXL) or intracorneal ring implantation, which can improve the visual prognosis [52-55]. Standard diagnostic modalities include topography, which accurately represents the corneal anterior surface, in conjunction with keratometry, and tomography, which is employed to evaluate, among others, the posterior surface and thickness of the cornea. Posterior corneal elevation has the greatest predictive value in preclinical keratoconus. In the diagnostic work-up of rare conditions – such as keratoconus – a single screening test can produce an excess of false-positive results. Therefore, it is advisable to employ other independent tests to corroborate the diagnosis. Useful new data can be provided by OCT-based epithelial thickness mapping. Histopathological studies on corneal transplant recipients have found that the epithelial thickness decreases at the site of the most pronounced thinning. OCT examinations have validated this observation, additionally revealing compensatory epithelial hyperplasia surrounding the elevated region, resulting in the epithelium taking on a donut-like shape. Epithelial remodeling can obscure stromal thinning and abnormal anterior curvature on topography. Consequently, conducting an additional examination facilitates the diagnosis. In patients scheduled for refractive surgery, epithelial mapping enables the planning of laser parameters. Atypical corneal epithelial thickness in myopia leads to an increased risk of postoperative refractive errors. Thinner epithelium elevates the risk of overcorrection towards hyperopia, whereas thicker epithelium increases the likelihood of residual defect formation. Knowing the preoperative thickness of the corneal epithelium allows for the planning of intraoperative flap size and incision depth, which is particularly important in refractive surgery involving ultrathin flaps. The cases presented illustrate the significance of corneal epithelial mapping in the process of eligibility assessment for refractive surgery, and existing literature reports provide evidence for the repeatability of this method. Extended wear of contact lenses or improper care practices can decrease the oxygen supply to the corneal tissues. Impaired oxygen metabolism can weaken the epithelial barrier, rendering the cornea more vulnerable to infections. Epithelial thinning due to extended contact lens use might serve as a mechanism for self-regulating the process of gas exchange between the cornea and the surrounding environment. Remodeling of the epithelium in contact lens wearers can lead to atypical topography and raise the suspicion of keratoconus or status post laser myopia correction. Combining topography and epithelial mapping, especially in the form of quantitative indices, facilitates the differentiation between these conditions. Both the literature presented and own clinical experience demonstrate that corneal epithelial mapping is a valuable diagnostic instrument in the field of ophthalmology.