


Summary
Non-traditional coronary disease progression risk factors have recently gained more attention because traditional risk factors are well documented and treated. The climate characteristics presented by ambient temperature exposure were examined in retrospective analysis. Night heat, called tropical nights, and mean daily temperatures were found to be significant for coronary artery disease progression in patients on optimal pharmacotherapy. Winter mean ambient temperatures were significantly different in patients in whom coronary artery disease progression was noted.
Introduction
Global warming is claimed to be an important cardiovascular disease risk factor, especially in a rapidly aging population [1]. There is growing evidence for heat effects on increased cardiovascular mortality [2–4]. Exposure to high temperatures can be regarded as causative factors of ischaemic heart disease, stroke, heart failure, and arrhythmia as the body’s response to heat include dehydration, hypercoagulability, and systemic inflammatory response [5]. In experimental studies, exposure to a high-temperature environment impairs cardiac health [6]. According to analysis by Fujimoto et al. [7], even short-term exposure to increased temperatures can trigger increased cardiovascular morbidity, presenting as acute syndromes requiring emergency hospitalisation. Patients over 65 years old exhibit low physiological tolerance to heat that is partially connected with age-related decline of the human body’s thermo-regulatory mechanisms [8, 9]. Nielsen et al. [10] in their analysis presented increased mortality in influenza patients related to cold winters and hot summer periods. Increased risk of premature death related to non-optimal temperature such as heat and cold exposure episodes were presented in the analysis by Burkart et al. [11].
Aim
The aim of the study was to point out possible implications of individually calculated environmental exposure, including air pollution and ambient temperature, for coronary angiography progression in patients presenting with chronic coronary syndrome.
Material and methods
Patients and method
There were 66 patients (41 [62%] men and 25 [38%] women) with a median age of 71.5 (62–76) years, who underwent repeated coronary angiographies due to chronic coronary syndrome within a median time interval of 145 (96–296) days. All the patients were treated according to contemporary chronic coronary syndromes guidelines, which included antiplatelets, angiotensin-converting enzyme inhibitors, β-blockers, and statins or statin/ezetimibe combination.
The temperature exposure was calculated individually for each of the patients and presented as median daily minimal and maximal values followed by days with median temperature exceeding 25 and 30°C. The tropical nights were estimated as the number of days with minimal temperature above 20°C were calculated for each patient individually.
Temperature method
Estimation of climate temperature parameter exposures (inc. mean daily winter temperatures and number of tropical nights – days with minimum temperature > 20°C) was based on data from international climate downscaling initiative EURO-CORDEX models [12] providing high-resolution climate projections within 12.5 km for Europe [13, 14]. For the final analysis we use Representative Concentrations Pathways emission scenarios – RCP4.5 [15] described by the Intergovernmental Panel on Climate Change (IPCC) in the Fifth Assessment Report (AR5) [16].
In our simulation, ERA-interim re-analysis [17] and daily temperature from European Climate Assessment & Dataset (ECA&D) [18] were used for boundary conditions. For data calibration, observations from the Polish Institute of Meteorology and Water Management were assimilated [19].
The high-resolution temperature calculated data we used in this study are widely available from the Institute of Environmental Protection – National Research Institute in Poland (IEP-NRI) web page [20].
Statistical analysis
Because the data did not follow normal distribution (Shapiro-Wilk test), parameters were presented as medians and interquartile ranges (Q1–Q3). The categorical data were presented as numbers and percentages. The comparison between groups was performed by Kruskal-Wallis test with post-hoc Dunn’s tests. When the comparison considered categorical data, the χ2 test of independence was used.
Two sample Wilcoxon (Mann-Whitney) tests were performed to present the differences between measured parameters including laboratory and clinical results. Results were presented as odds ratios (OR) and 95% confidence intervals (95% CI). A logistic regression was performed to find factors that predict progression > 30% of coronary lesions. Receiver operator characteristic (ROC) analysis was used to find the parameters with prognostic properties for coronary artery disease progression.
Statistical analysis was performed with the use of MedCalc® Statistical Software version 20.027 (MedCalc Software Ltd, Ostend, Belgium; https://www.medcalc.org; 2022). All tests were considered significant at p < 0.05.
Results
In 66 patients (41 [62%] men and 25 [38%] women) with a median age of 71.5 (62–76) years who underwent repeated coronary angiographies were enrolled into the retrospective analysis. The median interval time between repeated angiographies was 145 (96–296) days due to chronic coronary syndrome presented as angina equivalent. None of the patients was professionally active as pensioners. In a telephone questionnaire, they did not report any significant travel episodes that would be significant for the performed analysis. None of them reported air-conditioning modulators in their living place.
The arterial hypertension was diagnosed in 46 (70%) patients followed by hypercholesterolaemia in 45 (68%), and diabetes mellitus in 23 (35%). The mean body mass index was 28.8 (25.7–34.1). Patients were divided into two groups related to culprit lesion progression above 30% on repeated angiography. The decision on angiography was made based on clinical symptoms and a referring cardiologist’s opinion. The procedures were performed by the same experienced team of interventional cardiologists working in the First Cardiology Department of Poznan Medical University.
The first group representing the comparable culprit lesion changes was composed of 48 (73%) patients, and the second group comprised 18 (27%) patients in whom atherosclerotic plaque progression was noticed. The individually calculated air pollution exposure in the place of habitation for each patient was performed, and median values are presented in Table I.
Table I
Demographic and clinical characteristics
All patients were pharmacologically treated according to current guidelines on the management of coronary artery disease. The diabetic patients were followed up by repeated measurements of glycated haemoglobin if diabetes was diagnosed. All patients were using statins. The lipid profile results are presented in Table I.
In the presented group, the repeated angiographies were performed within a mean 145 (96–296)-day interval due to planned multi-stage PCI (59 [89%] pts) or angina symptoms reoccurrence (7 [11%] pts). The results of initial and control angiographies are presented in Table II.
Table II
Angiographic findings on initial and repeated examination
The possible factors that could play a crucial role for coronary lesion progression were evaluated by logistic regression including uni- and multivariable analysis, as presented in Table III.
Table III
Uni- and multivariable regression analysis for coronary lesion progression
The univariable analysis presented the significant predictor of sex differences (p = 0.038) for coronary lesion progression. In the multivariate logistic regression model with backward stepwise elimination method (Table III), tropical nights (p = 0.047) and mean daily temperatures (p = 0.043) were revealed as predictors of coronary lesion progression > 30%.
Receiver operator curves for atherosclerosis progression prediction
Among multivariable analysis results, the mean values of ambient temperature and tropical nights were presented as significant. The receiver operator curve (ROC) analysis was performed separately for mean temperatures (AUC = 0.395, p = 0.193) and tropical nights (AUC = 0.582, p = 0.310). The ROC analysis for combined exposure to both parameters presented significance (AUC = 0.680, p = 0.025) for coronary artery lesion progression > 30%. The results are presented in Figure 1.
Figure 1
Receiver operator curve analysis for combined tropical night and mean ambient temperature exposure to > 30% epicardial atherosclerotic lesion progression

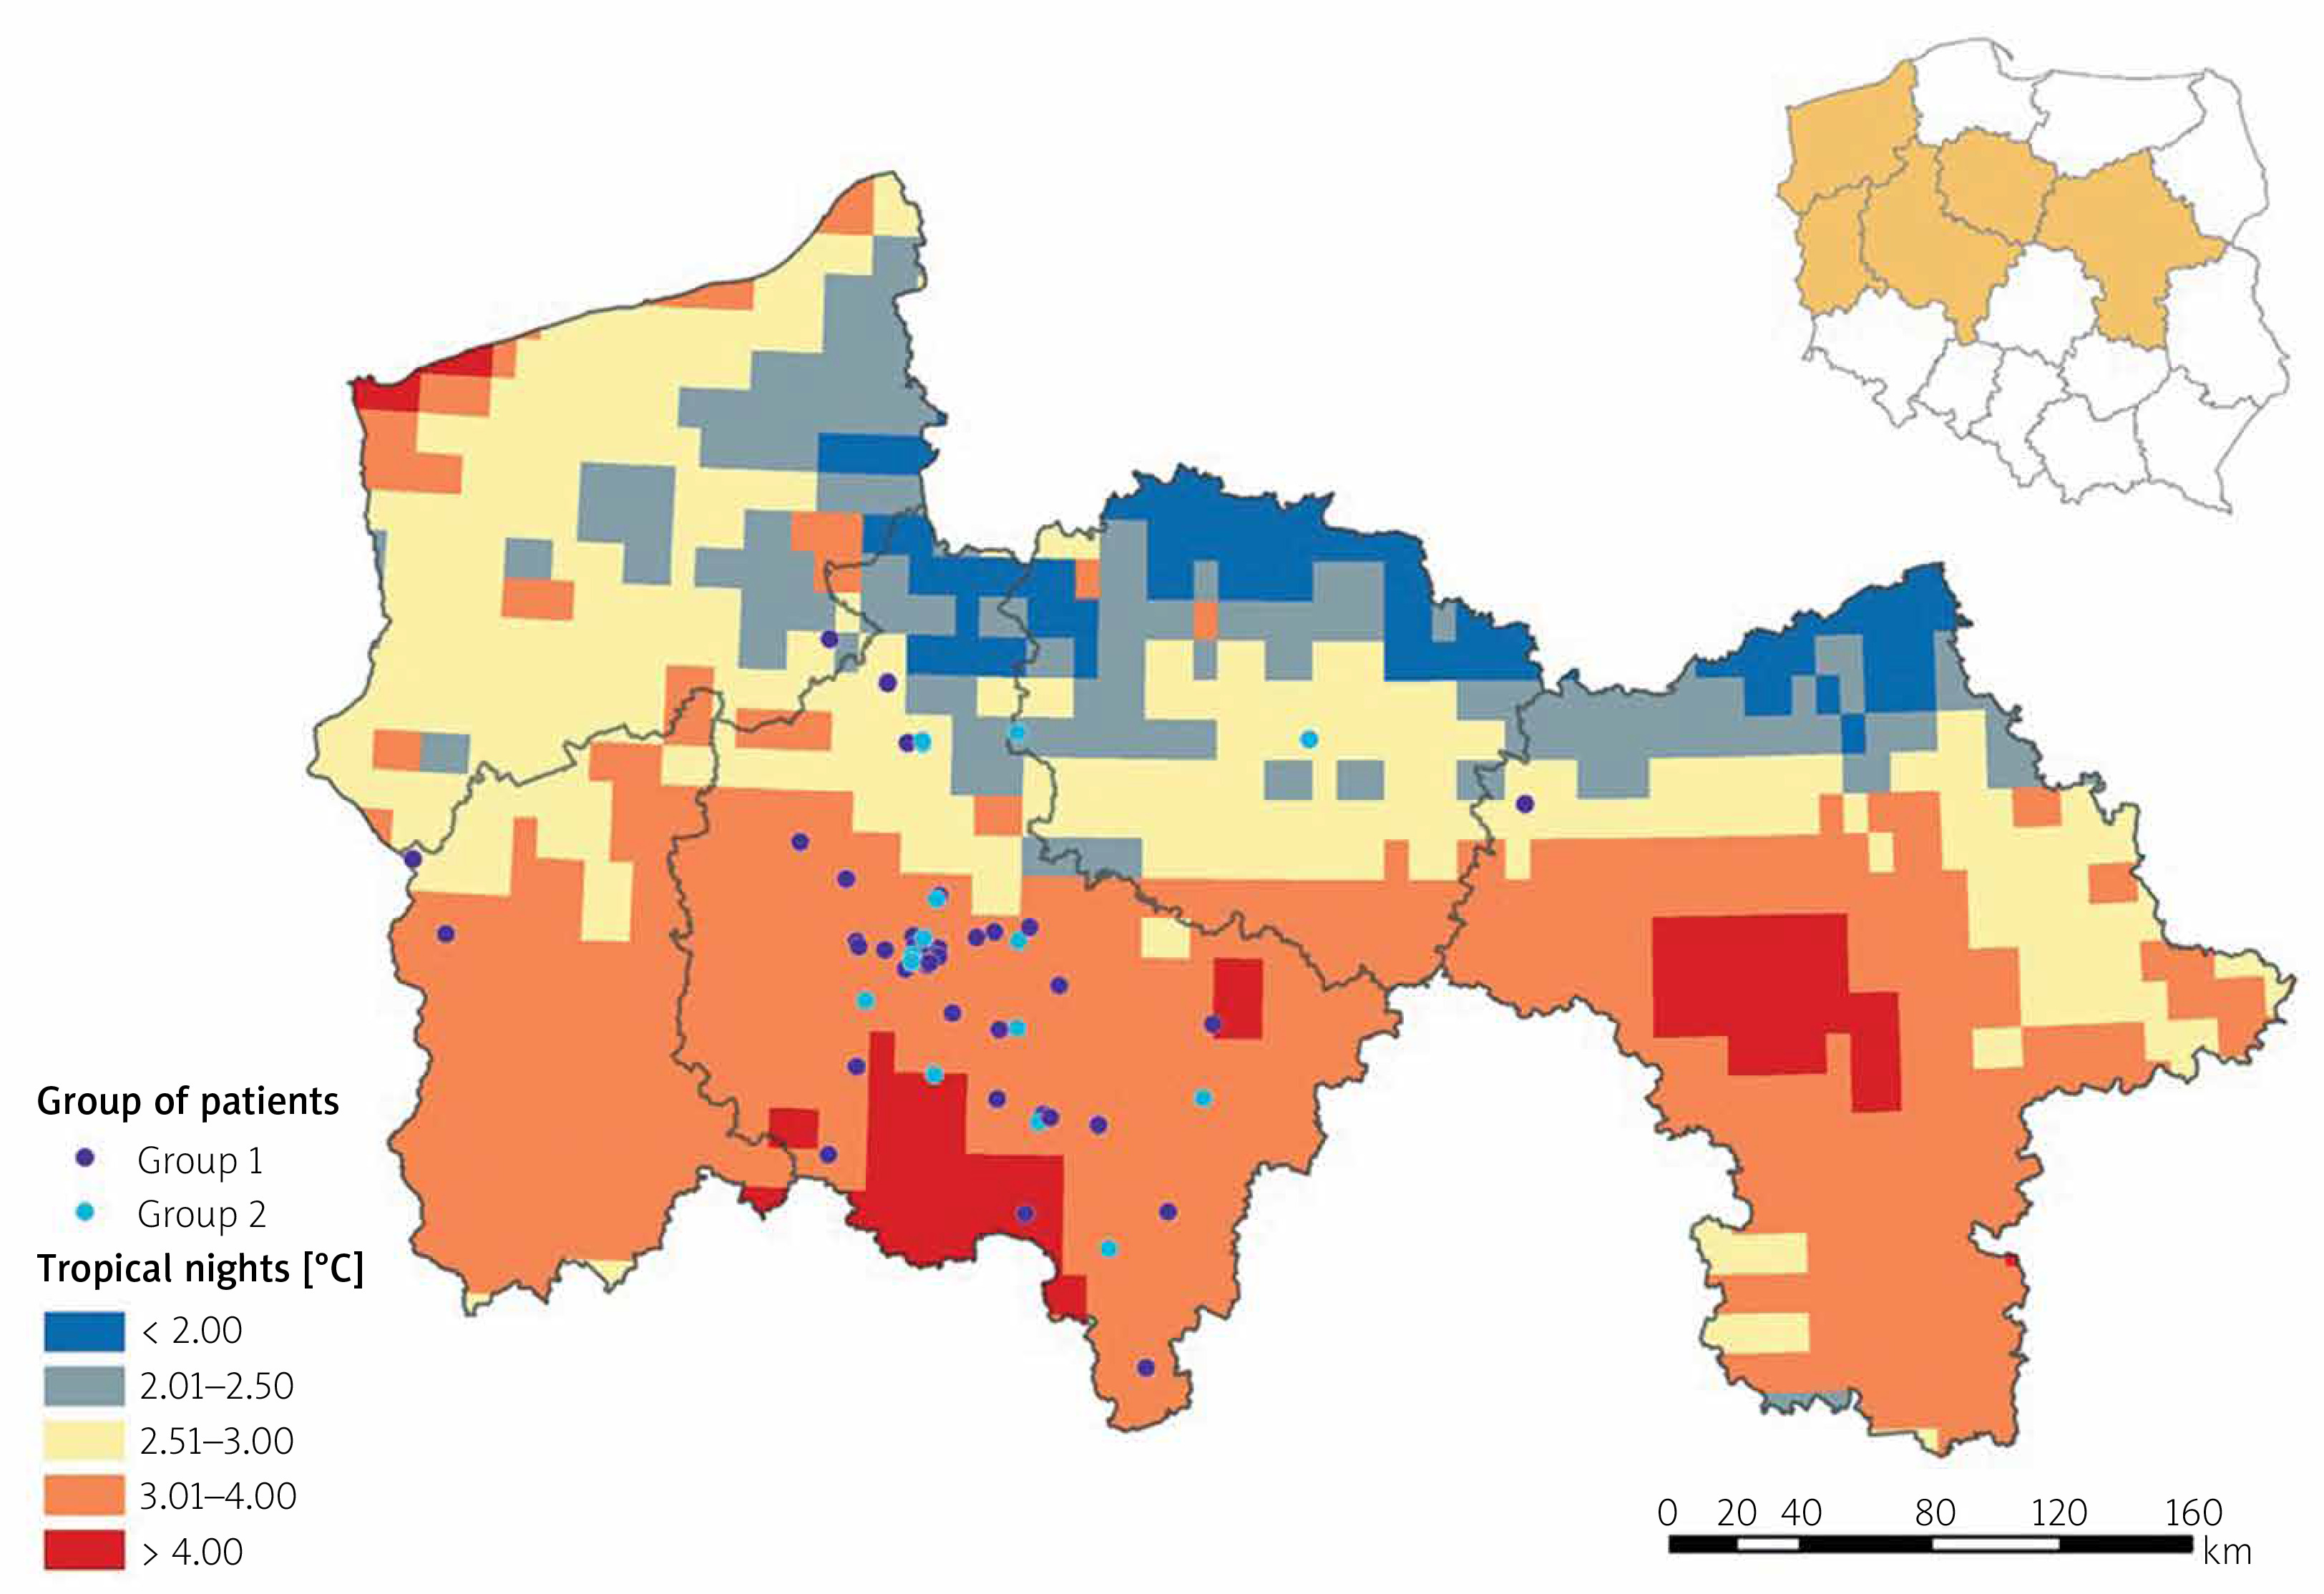
The geo-map was created to present the relationship between habitation location, and individual exposures to tropical nights are presented in Figure 2.
Figure 2
The individually calculated exposure for high temperatures presented as tropical nights in the presented study related to the place of living
The mean values of yearly temperatures were found to be one of the significant factors for coronary lesion progression. The further sub-analysis of the seasonal temperature characteristics was performed, as presented in Table IV.
Table IV
The seasonal mean values of ambient temperature
| Season | Temperature characteristics Yearly values of ambient temperature | Group 1 n = 48 | Group 2 n = 18 | P-value |
|---|---|---|---|---|
| Spring | Mean temperatures (median (Q1–Q3)) Minimal temperatures (median (Q1–Q3)) Maximal temperatures (median (Q1–Q3)) | 8.900 (8.850–8.940) 4.410 (4.328–4.453) 13.830 (13.715–13.930) | 8.860 (8.747–8.933) 4.360 (4.225–4.445) 13.815 (13.622–13.915) | 0.224 0.250 0.460 |
| Summer | Mean temperatures (median (Q1–Q3)) Minimal temperatures (median (Q1–Q3)) Maximal temperatures (median (Q1–Q3)) | 18.725 (18.630–18.740) 6.350 (6.232–6.380) 23.920 (23.790–23.990) | 18.740 (18.538–18.750) 6.305 (6.183–6.370) 23.990 (23.742–24.038) | 0.265 0.173 0.253 |
| Autumn | Mean temperatures (median (Q1–Q3)) Minimal temperatures (median (Q1–Q3)) Maximal temperatures (median (Q1–Q3)) | 10.170 (10.117–10.190) 6.350 (6.232–6.380) 14.050 (14.01–14.170) | 10.165 (9.978–10.170) 6.305 (6.183–6.370) 14.11 (13.950–14.187) | 0.151 0.173 0.908 |
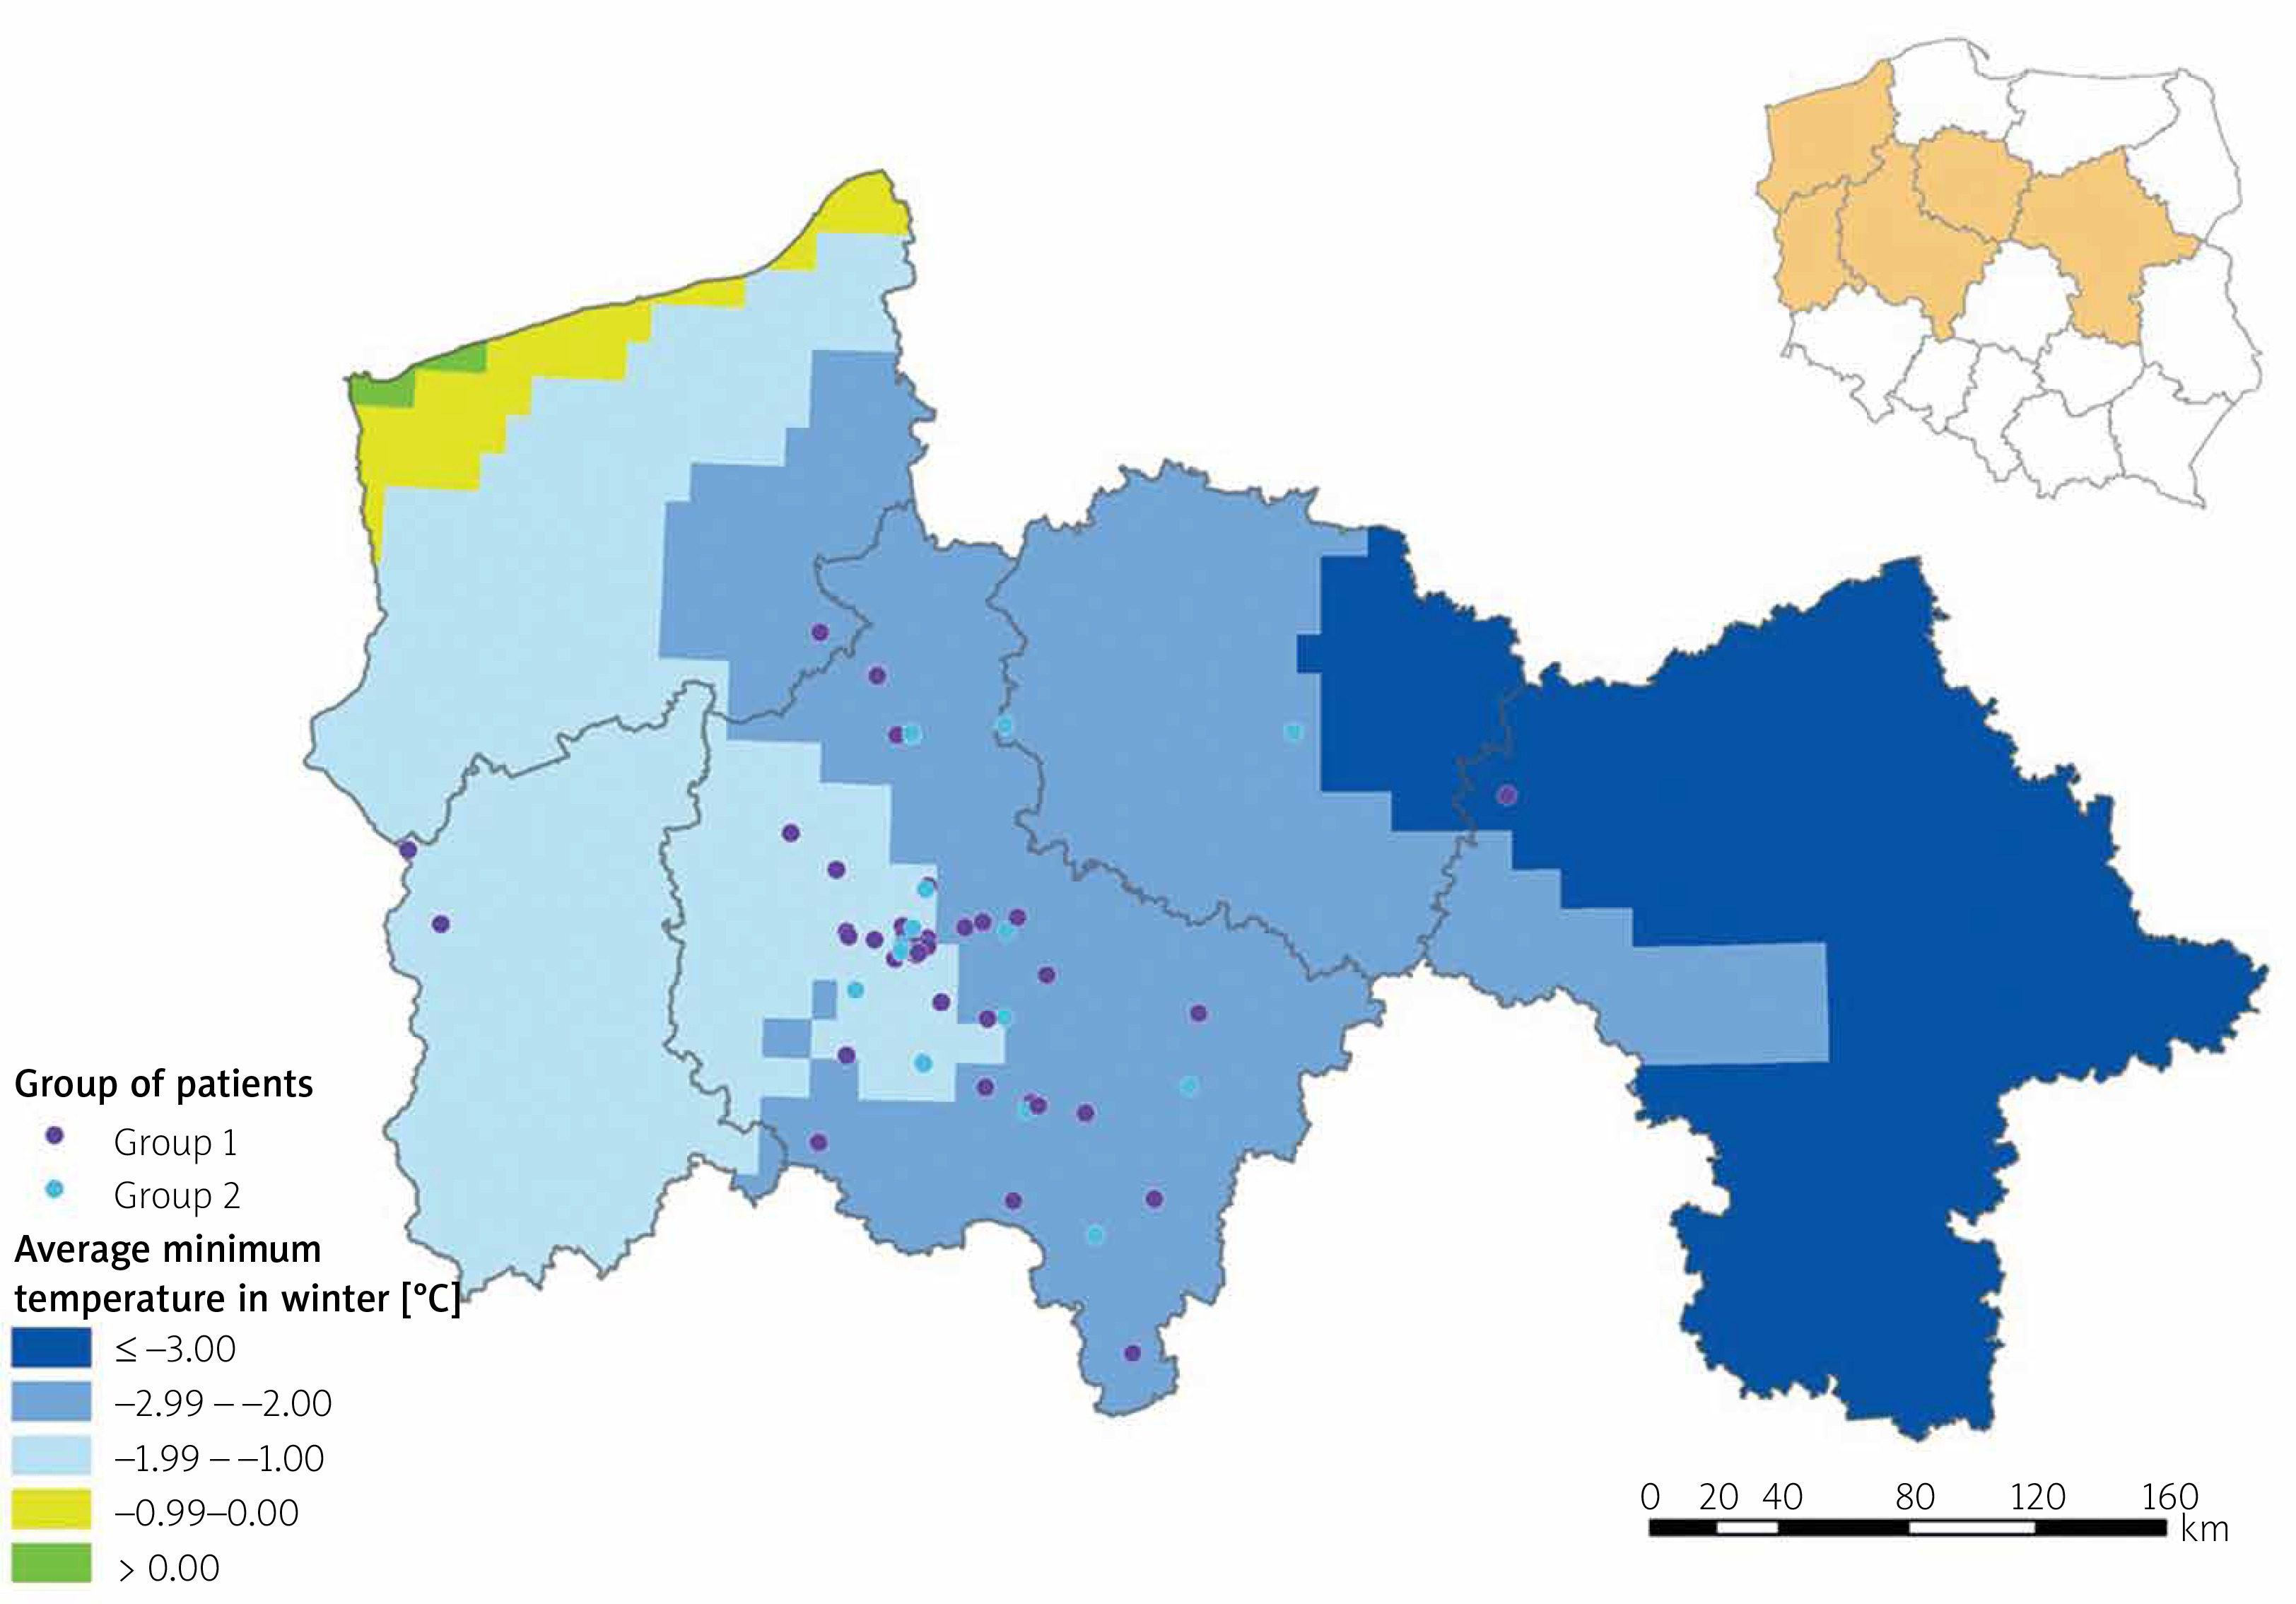
| Winter | Mean temperatures (median (Q1–Q3)) Minimal temperatures (median (Q1–Q3)) Maximal temperatures (median (Q1–Q3)) | 0.954 (0.790–0.950) (–)1.95 ((–)2.085–(–)1.805) 3.170 (3.155–3.280) | 0.720 (0.520–0.930) –2.105 (–2.178–(–1.917)) 3.130 (2.953–3.280) | 0.151 0.018* 0.439 |
The analysis of seasonal temperature changes showed significant differences related to minimal winter temperatures between both groups (p = 0.018). Because the minimal winter temperatures were found to be significantly different between groups, a geo-map presenting the individual exposure was created (Figure 3).
Discussion
Our analysis presents the relationship between heart exposure and increased risk for coronary artery lesion progression in multivariable regression analysis. The study was constructed on individual exposure risk for air pollution and heat. This is the first study, to the best of our knowledge, presenting the relationship between individual exposure to environmental factors and coronary lesion progression.
According to our results, the tropical nights, defined as 24-hour temperature above 20°C, and temperature exposure including winter minimal temperatures were found to be predictive for culprit lesion progression.
In our climate zone, more deaths are reported in the “cold season” than in the “warm season” [21]. The transition seasons have been disappearing for several years due to climate change [22], which has had a significant impact on physiological mechanism derangements [23, 24] followed by increased morbidity [25, 26]. In the epidemiological study by Alahmad et al. [27] analysis from 27 countries revealed an association between cardiovascular disease-related increased mortality and exposure to extreme either hot or cold ambient temperatures.
Kim et al. [28] in their analysis revealed a strong association between hot nights and increased mortality, presenting acute corresponding associations. Risk mortality estimates were higher for extremities than for durations of up to 7 days of heat exposure, as presented by Roye et al. [29]. An association between morbidity and as little as 2–3 days ambient heat was suggested by Chen et al. [30]. In a study by Saucy et al. [31], myocardial infarctions and hypertension-related deaths were found to be particularly strongly related to extreme temperatures of mean value 24°C. In our analysis, the predictive value for coronary artery lesion progression of high daily mean temperatures estimated at above 20°C was noticed.
The low universal apparent temperature in the study by Lin et al. [32] was associated with increased hospital admissions due to ischaemic heart disease. Temperature changes between neighbouring days during winter season were claimed, by Ma et al. [33], to induce increased cardiovascular morbidity risk, especially in the elderly population. In the analysis by Singh et al. [34] the eradication of inhouse cold estimated as indoor temperature below 18°C allowed for achievable cardiovascular health gains. Bai et al. [35] revealed that ambient cold and heat episodes translated into 2.49% and 1.20% increased risk of cardiovascular diseases and related hospitalisations, respectively.
Our analysis was performed within a group of patients who underwent repeated angiography within a relatively short period of time, suggesting newly developed coronary lesions despite optimal pharmacotherapy. Importantly, neither subgroup differed in clinical and laboratory parameters, and traditional risk factors, including diabetes and dyslipidaemia, did not influence the multivariable analysis result. We suspect that the diagnosed culprit lesions are characterised by instability and may be prone to rupture. The atherosclerotic plaque progression involves the sequels of mechanisms including matrix synthesis, angiogenesis, arterial remodeling, and fibrous cap rupture or erosion [36]. The large lipid-rich necrotic core covered by a thin fibrous cap of the ruptured lesion is infiltrated by macrophages and inflammatory cells [37]. The erosion-prone plaques are represented by a more heterogeneous group and are described by an acute thrombus formation [38]. Katayama et al. [39] presented the correlation between winter season and increased risk of atherosclerotic plaque rupture. Cold induced endothelial injury followed by plaque burst on animal experiments was shown by Fang et al. [40]. Guinea et al. [41], in an experimental model, related culprit lesion instability with body temperature. The mentioned studies are with co-ordinance to presented personalized analysis that indicate the relation between minimal ambient temperatures and epicardial disease progression. Therefore, we believe that there is a need for public awareness of such phenomena. Ellena et al. [42] in their study highlighted an overall increase in mortality risk trends under cold and heat conditions and concluded that targeted public health responses to cold and heat are necessary to adapt to extreme temperatures due to climate change.
Study limitations
The study was performed on a selected group of patients presenting with chronic coronary syndrome, who were evaluated by repeated angiograms due to angina equivalent syndrome. In the presented group, the individual exposure was calculated in the place of habitation. The results were obtained based on a personalised approach.